How many shooters were at the Trump rally on July 13, 2024?
Published . Edited .One can confirm or deny some theories about the July 2024 assassination attempt on Donald Trump using the event’s many recordings. This article demonstrates an approach to using audio spectrograms from publicly available video footage to discover how many shooters were at the Trump rally in July of 2024 as well as which theories are plausible.
The theories
Theory zero: the official theory of one guy on a roof
The official theory is that a person shot at Trump from a American Glass Research (AGR) building around 140-150 yards away, roughly from the north of the stage. At least one person witnessed someone climbing up onto this roof with a backpack and rifle.
Theory one: a shooter from the bleachers to the south
A slow motion replay focused on the bleachers behind the podium and to the south showed a puff of smoke to the far right followed by one of the victims to the left of that puff falling down, followed by another victim further to the left falling down. A commenter said the order of those events in slow motion suggested a shot fired from the right, near the bleachers, behind some black curtain.
Theory two: a shooter from the water tower
There are some witnesses who said they saw someone on the water tower. One video seems to show a dark figure on the tower when zoomed in.
Theory three: a shooter from within an AGR building
There are several windows from building that are part of the (formerly) AGR campus. For example, a congressman showed a video after the events from one of these windows.
Analyses
The most obvious analysis is to look at video footage showing a shooter shooting. A less obvious analysis is to look at the audio.
Video analysis limitations
Video presents several challenges. First, we cannot see a bullet in the typical video. Second, there is limited footage of the places in question. Almost all videos are focused on the stage while the rest focus on people interacting with each other or security staff. Third, the typical frame rates and compression techniques remove or change a lot of data.
For example, when looking at the available water tower footage, it is zoomed (or cropped) so far that it is difficult to tell whether the dark figure is a person or an artifact of video compression. None of the videos show a muzzle flash, even the videos that attempt to focus on the theory zero shooter.
There is a well-known problem with visual witnesses and visual memory. Vision is reputed to be actively constructed by the brain. When looking at video footage, we aren’t relying on a person’s recollection, but we may still see what we wish to see.
Audio analysis advantages over video
Audio recording samples much more frequently than video. Typical video frame rates are 24, 30, and 60 frames per second. Audio is typically 44100 or 48000 samples per second. While several samples are required to hear a thing from these samples, it is not hard to identify particular sounds with millisecond precision.
Audio recordings also capture more of the sound spectrum than most of us can hear.
With a high sample rate and wide frequency range, spectrograms of audio can provide precise and clear data.
Crack-boom analysis
Rifles and pistols usually fire supersonic projectiles. Each shot results in two apparent sounds: a crack and a boom. The crack sound is from the bullet traveling at supersonic speeds while the boom sound comes from the muzzle of the rifle. When a hearer is directly in the line of rifle fire more than a few yards away, he first hears the crack and momentarily later hears the boom. When a hearer is parallel to the line of fire, he may hear a boom followed by a crack or some mixture of crackles and a boom.
Using the principle of a crack and boom, and assuming that bullets were actually directed at the podium, if one can find cracks and booms in the audio then one can learn much about what happened. Perhaps as importantly, one may learn what did not happen.
Finding cracks and booms
Here is the C-SPAN audio spectrogram in the free/libre audio tool Audacity for the first three shots heard:
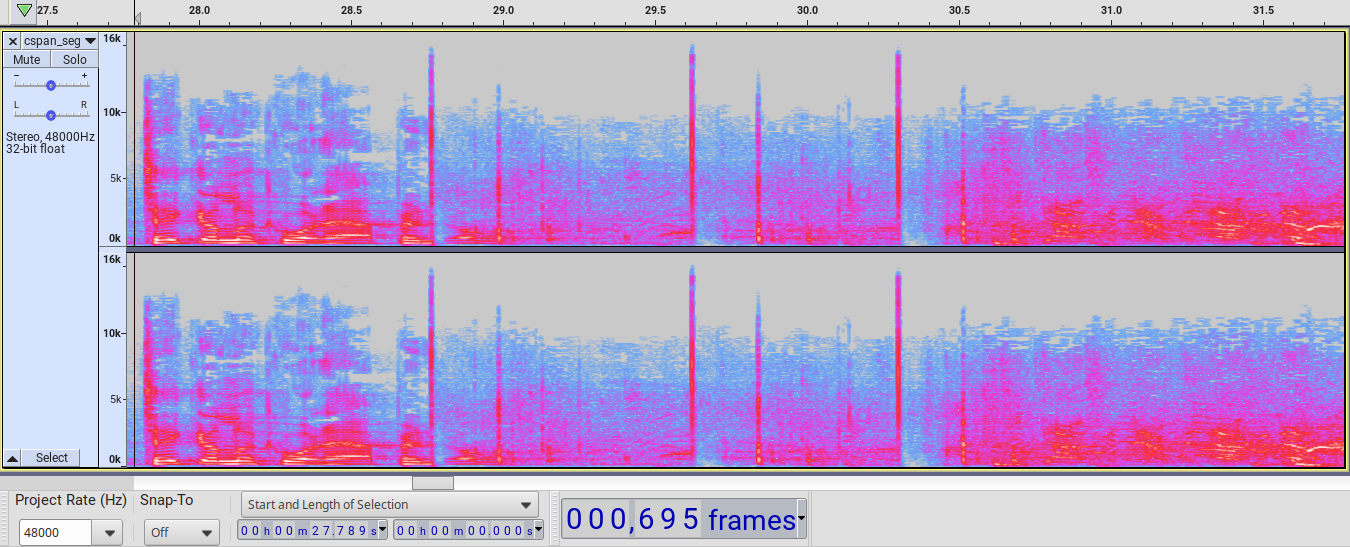
Without slowing down the playback, one can hear both cracks and booms. It is obvious to see the cracks and booms in this example spectrogram. The crack is a higher frequency sound and the boom is a lower frequency sound (see especially the 1Hz-500Hz area) but each appears as a distinct column of sound in the graph.
By zooming in on the first crack-boom pair, one can select the centers of those two sounds and then see the duration in seconds below. Because there are 48000 samples per second, there are 48 frames per millisecond, so it is not difficult to look at these with millisecond precision.
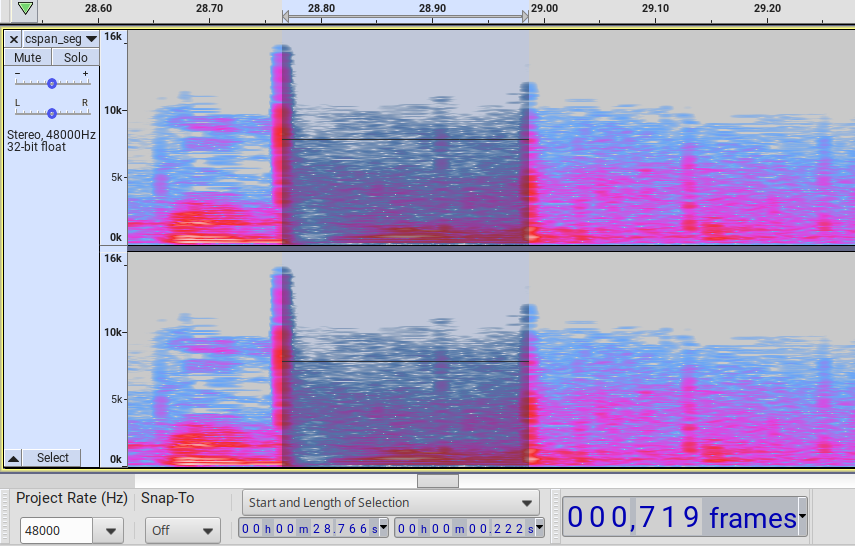
The crack-to-boom duration for the first shot in the C-SPAN audio is 222 ms (milliseconds). It does not appear to be outside the range of 220 ms to 224 ms. Following the same technique, the duration for the second crack-to-boom is 218 ms and for the third shot it is 214 ms.
For three other news stations, it is 222 ms to 223 ms for the first shot, 217 ms to 219 ms for the second, and 212 ms to 213 ms for the third. It sounds as though these organizations received the same audio feed, a feed from microphones on the stage. Using this technique for four different news recordings shows remarkably consistent results given the potential differences in equipment and processing. The spectrogram does in fact differ between the various news organizations, indicating different processing techniques. Here, for example, is a CNN spectrogram corresponding to the above C-SPAN for the first three shots:
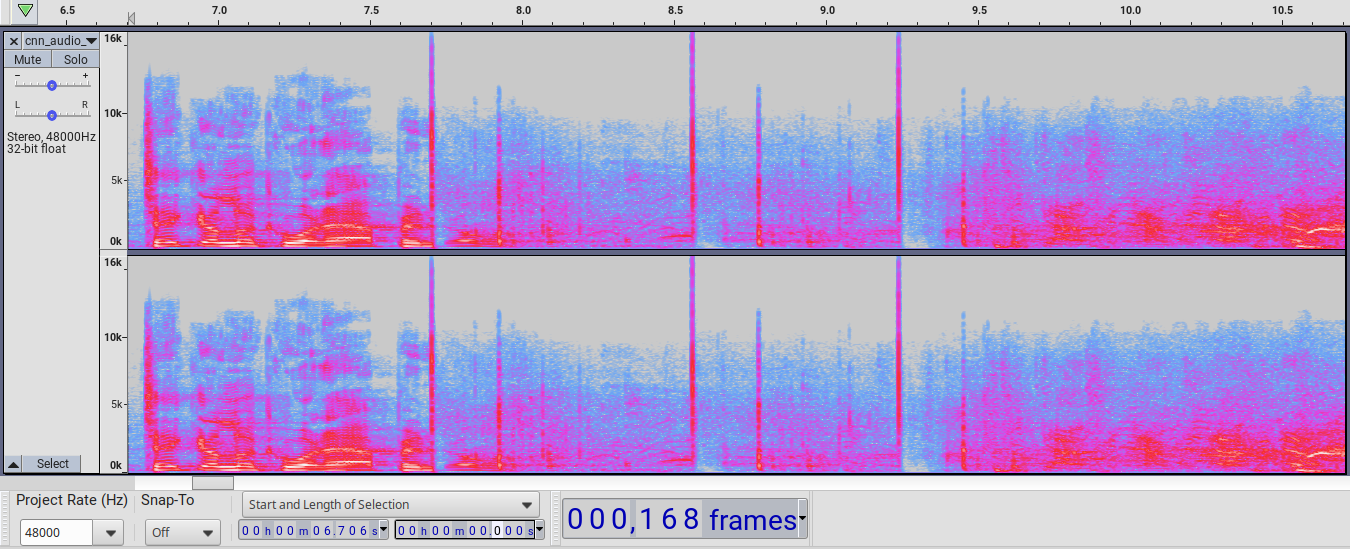
While it has the same general shape as the C-SPAN audio, there are differences. The most obvious is that CNN’s frequency range goes above 16 KHz for the three crack sounds while the C-SPAN range does not. The fact of differences indicates these are videos that came from several sources. For each separate source, one gains confidence in the conclusions. When one video with the podium audio shows 222 ms, one could guess that it was actually 222 ms. When four videos having the podium audio show 222 ms to 223 ms we are almost certain that what came through the audio feed from the podium was 222 ms to 223 ms. It is certainly not lower than 197 ms and certainly not higher than 247 ms for that audio feed from the microphone because those would be entirely outside the span of the crack and boom sounds on all the spectograms.
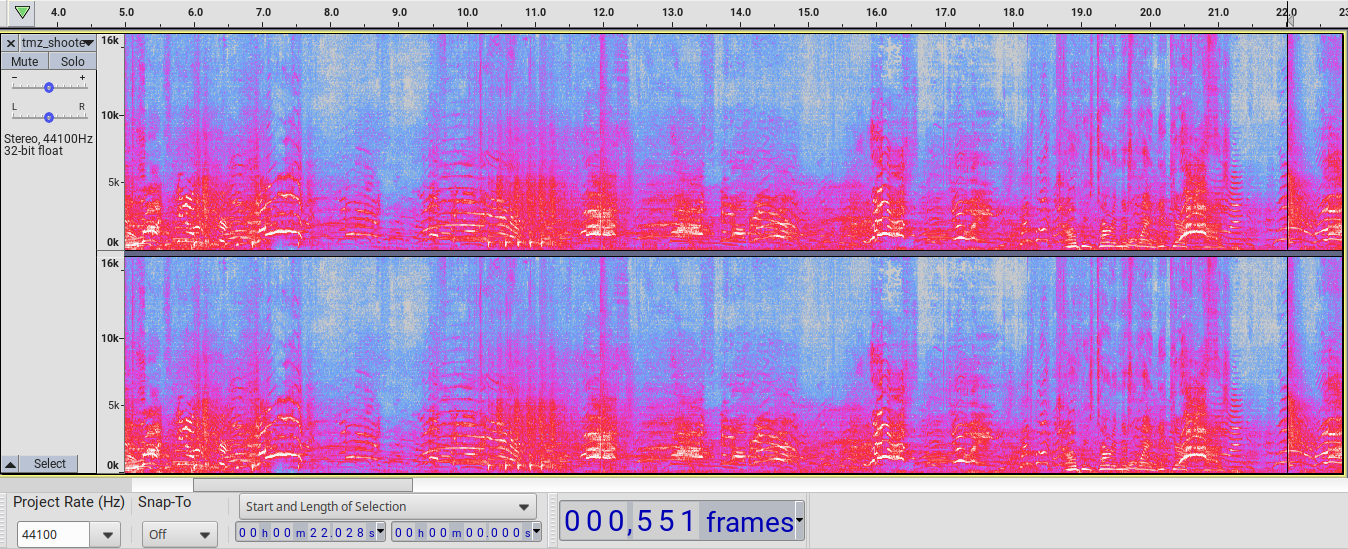
Here is a spectogram from video someone to the southwest of the AGR building sent to TMZ:
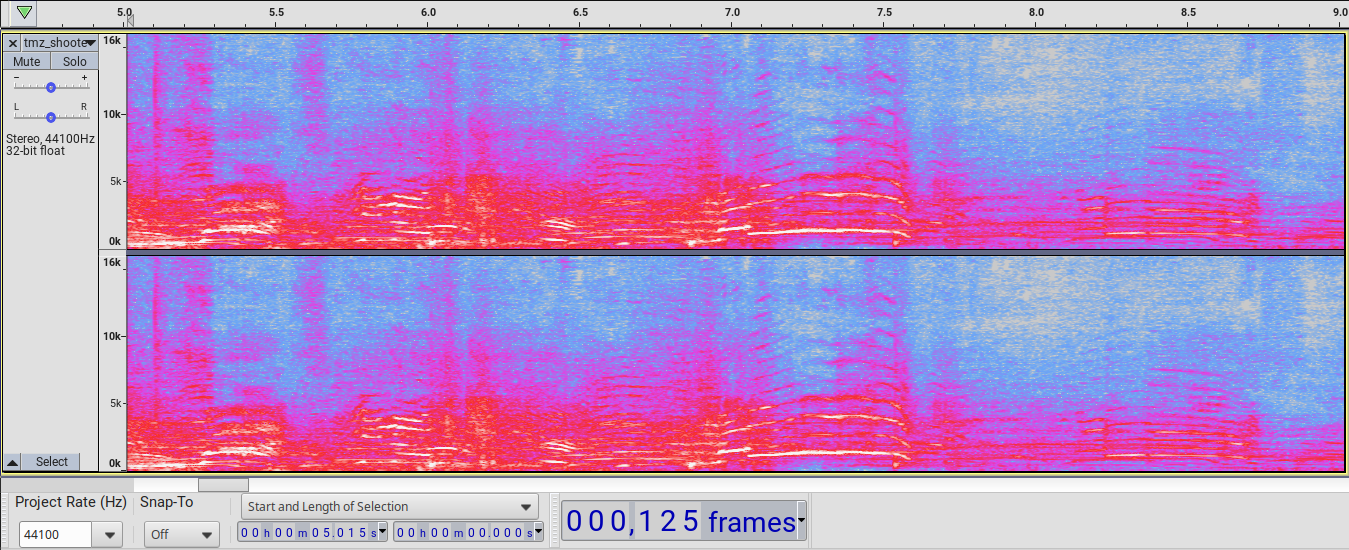
This audio is completely different a bit to the south and west of AGR. One hears no sharp crack sound but rather a boom or blam followed by a crackling sound. The booms can be seen roughly where the cracks above were seen in the above CNN and C-SPAN spectrograms. The most obvious sound when listening and when looking at the spectrogram is a person screaming “Russ” around shots two and three.
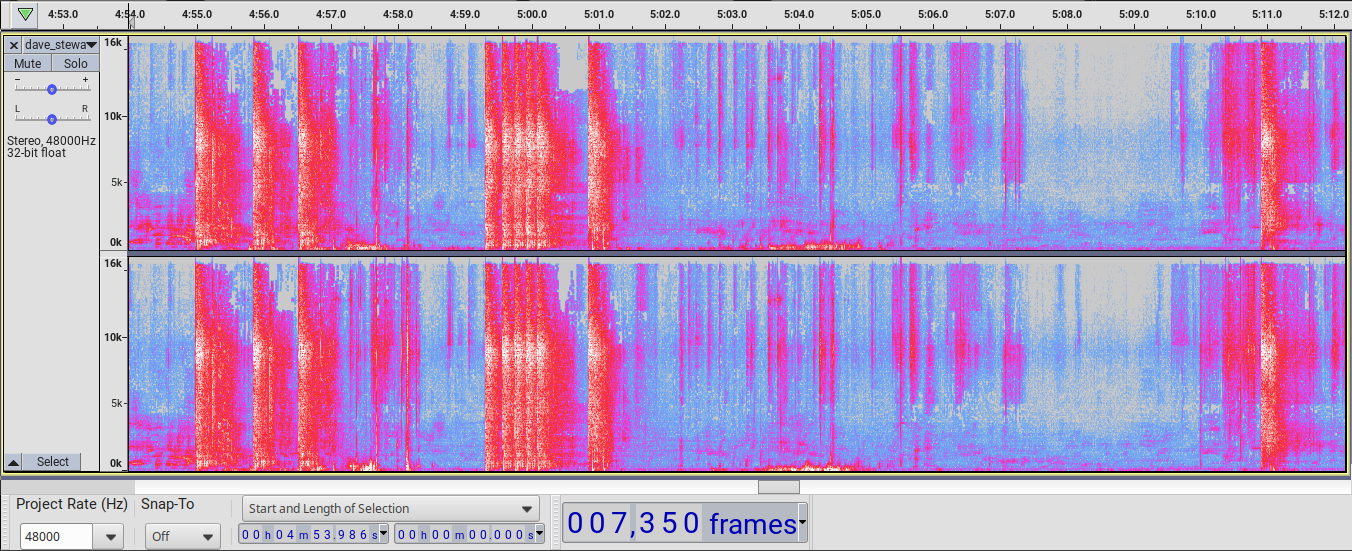
Here is a spectrogram from Dave Stewart who was close to AGR, between AGR and the stage:
The crack sounds are plainly visible but the booms also can be seen and heard, for example about 30 ms after the first crack.
Here is a spectrogram from Jon Malis between Dave Stewart and the one sent to TMZ, closer to the TMZ footage:
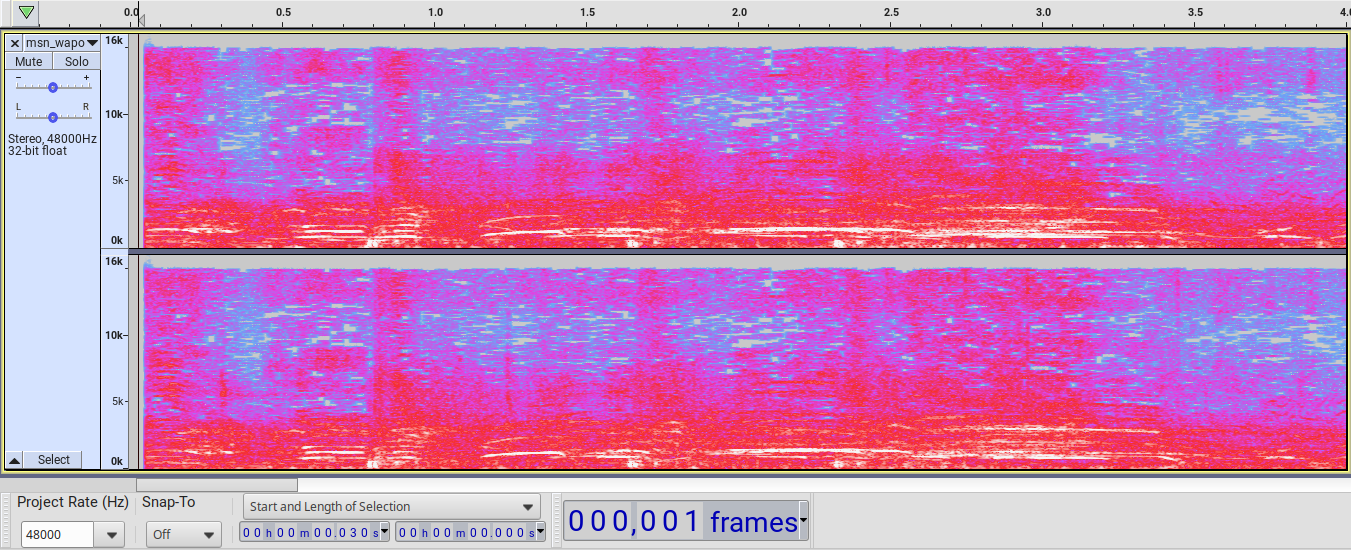
The cracks or crackles are somewhat visible but are after the booms which are seen around the 790 ms, 1647 ms, and 2325 ms marks, respectively.
How many shots were fired?
In the audio from the podium, it is clear that three shots took about 1527 ms, followed by a pause, followed by several more shots that appear similar to the first three, then another that looks different from the first eight, and finally a last shot that looks different from the one. From Jon Malis, Dave Stewart, and the submitter to TMZ it is more clearly seen to be ten total shots. Three, five more, a ninth, and a tenth.
Here is a spectogram covering all shots from RSBN’s alternate angle:
The first three shots can be seen from the 6640 ms mark (first shot crack) to the 8388 ms mark (third shot boom). Then there is a pause until a crack at the 10957 ms mark and several more shots until a boom around 11945 ms. The second-to-last shot is a crack and/or boom at 12440 ms followed by two echoes. This shot’s signature is clearly different from those that precede and also the last shot with a single crack and/or boom at 22433 ms.
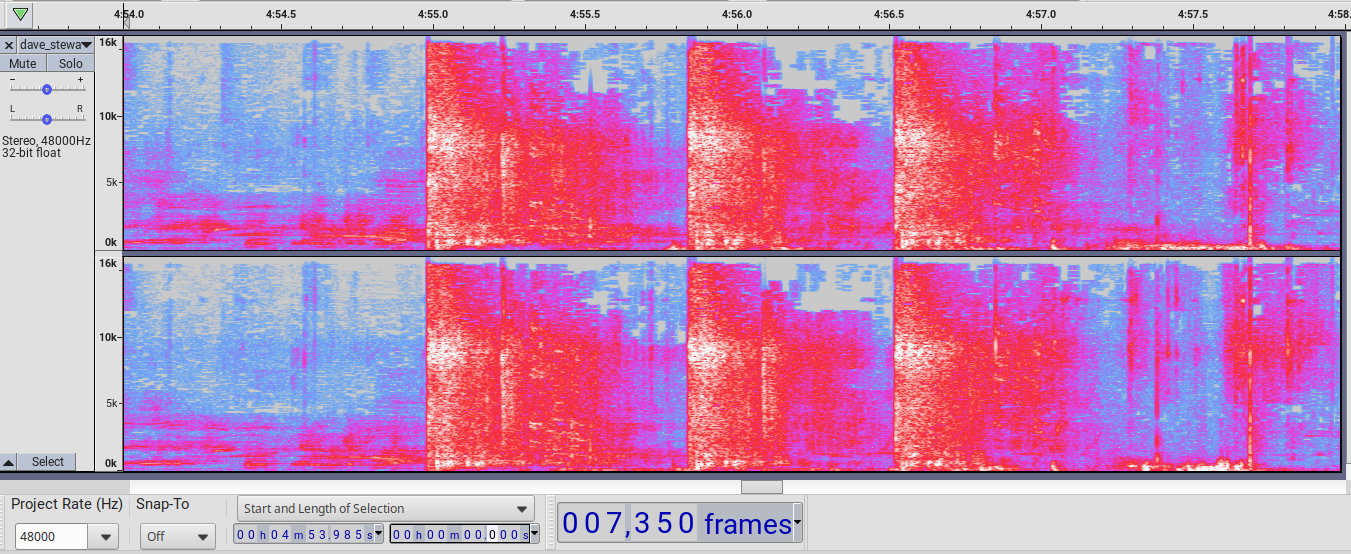
Here is a spectrogram from Dave Stewart’s X account covering all shots:
Dave Stewart’s audio clearly shows ten distinct shots and includes a wide separation of crack and boom for the tenth shot relative to the others. Shots nine and ten are distinct from the first eight. The 145 ms crack-to-boom for the tenth shot indicates that Dave Stewart was down rage of that shooter.
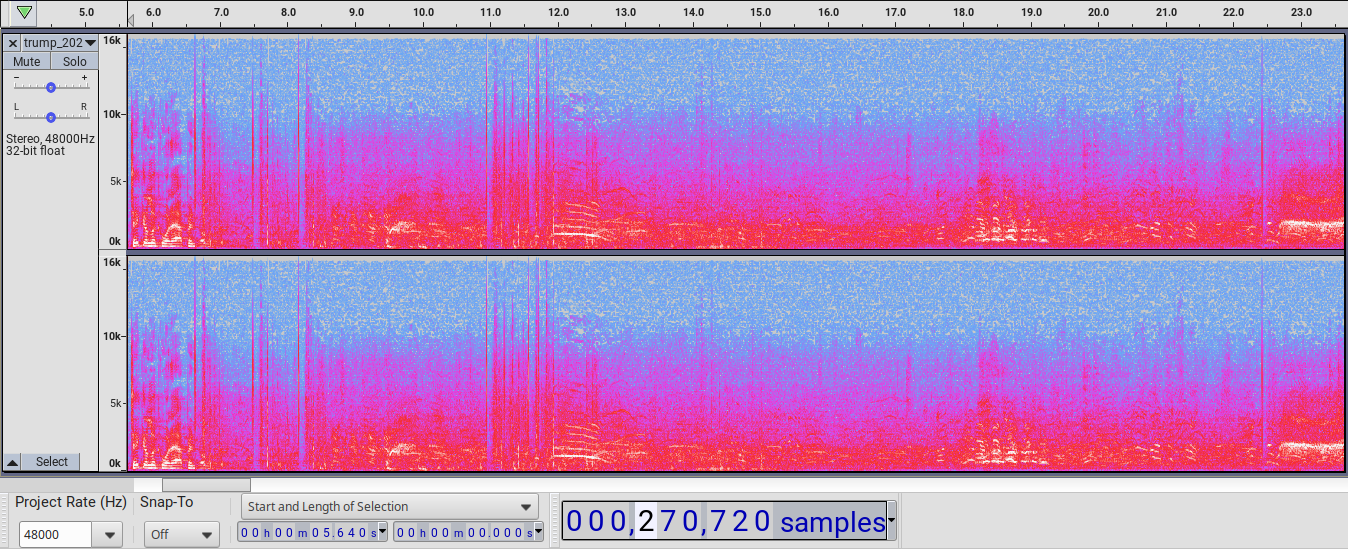
Here is the spectrogram from the footage given to TMZ covering all shots:
Look along the low frequencies at the bottom for the five shots between 10 s and 12 s. The first three booms are similarly found at 6015 ms, 6870 ms, and 7544 ms. Shots one through eight have a boom preceding a crack or crackle. At 11970 ms is shot nine’s crack and its boom follows at 12017 ms. Shot ten’s crack is at 22041 ms with a boom around 22295 ms that can only be seen in the spectrometer, not heard when listening.
In summary, there are ten shots in under seventeen seconds. The first three span just over one and a half seconds. Then there is about a two and a half second pause followed by five shots in three quarters of one second. These first eight shots appear similar in each of the respective recordings. Less than a second later a distinct ninth shot occurs and finally, about ten seconds later, the tenth and final shot.
Questions raised or answered by initial audio analysis
What was the speed of sound at this event?
The speed of sound is useful to draw conclusions from audio timings.
According to the National Weather Service, the speed of sound can be estimated based solely on temperature. The temperature at the event ranged from about 89 degrees Fahrenheit (degF) at 5:56 pm to about 87 degF by 6:56 pm. Estimates of the speed of sound in feet per second (ft/s) near those temperatures follow.
85 degF: 1143.78 ft/s
86 degF: 1144.83 ft/s
87 degF: 1145.88 ft/s
88 degF: 1146.93 ft/s
89 degF: 1147.97 ft/s
90 degF: 1149.02 ft/s
91 degF: 1150.06 ft/s
A range of 1143 ft/s to 1150 ft/s is almost certain.
These temperatures are usually taken about six feet above the ground. If the shooter was on a building and Trump was on a raised platform, both would have been at slightly lower temperatures. But not enough lower for our purposes. Assuming a high-end lapse rate of 5 degF per thousand feet of elevation, being ten feet higher would only change the temperature 0.05 degF.
The shooting was closer to 5:56 pm than 6:56 pm, therefore closer to 89 degF than 87 degF.
An estimate of 1147 ft/s suffices for these analyses. Feet per second is a convenient unit because it is the usual unit for pistol and rifle bullet ballistics. Since we are working at millisecond precision in the audio analyses, we may find it helpful to think of it as 1.147 feet per millisecond (ft/ms).
What has been reported about shots nine and ten?
The last shot (shot ten) is reported as counter-sniper fire, killing the person on the roof of the AGR building. The ninth shot is less widely reported, but there is a Washington Post article suggesting it was a local police officer who shot at the person on the AGR roof.
How far away was the first shooter?
The first three shots were critical in that they were fired while Trump stood. The audio is most clear in most videos for these three as well.
Given that there was a crack followed by a boom for these three shots, we can reasonably conclude that the bullets averaged supersonic speed, meaning they traveled above 1147 ft/s. They were not subsonic rounds.
Assuming the first three shots came from the same shooter, the shortest crack-to-boom delay was 213 ms. The absolute minimum distance can be known based on the speed of sound and this shortest delay. A faster round causes a longer duration between the crack and the boom while a slower round yields a shorter duration. Using an estimated 1147 ft/s, we can multiply 1147 ft/s by 0.213 s and get a minimum theoretical shooter distance of 244 feet or 81 yards. The reason this is a minimum distance is the bullet would have to be traveling at infinite speed, arriving instantaneously, and then we hear the boom 213 ms later, with the boom traveling at 1147 ft/s.
If the shots came from a minimum of 81 yards away, it is impossible that they came from the bleachers to the right of Trump. Theory one is disproven.
Is the official story of a shooter on the AGR roof plausible?
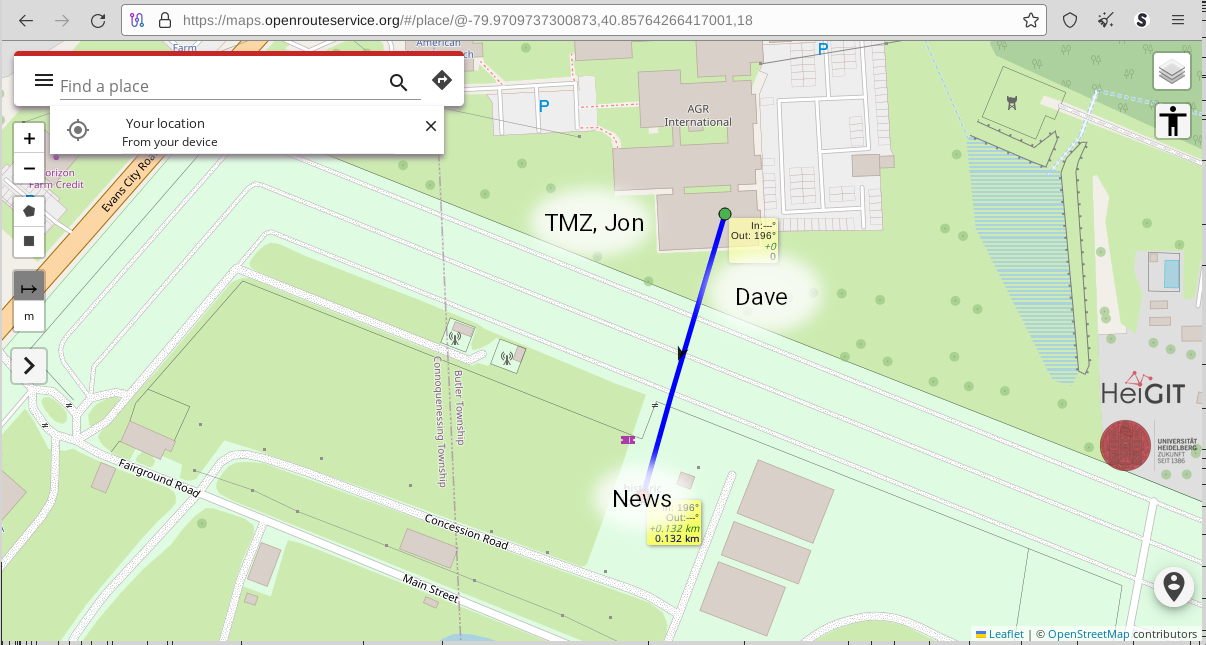
By looking at various pictures, videos, and maps, the range from the dead person on the AGR roof to the stage microphone is about 132 meters, 433 feet or 144 yards.

The videos on the AGR roof show and reports say an AR-15 style rifle was there, along with eight brass casings from .223 caliber or 5.56 mm rounds.
Using Federal’s ballistics calculator, one can select a typical 55 grain FMJ .223 caliber round. Assuming an elevation of about 407 meters (1335 feet) and temperature (see above) about 88 degF, a simple average of the (10 yard increment) speed values from 0 to 150 yards gives 2991 ft/s. It would take 433 ft / 2991 ft/s or 145 ms for the bullet (crack) to arrive, then 433 ft / 1147 ft/s or 378 ms for the boom to arrive, causing a 233 ms crack-to-boom delay. This is 10 ms, 15 ms, and 20 ms longer than the shortest to longest delays for the first three shots.
Suppose a heavier bullet were used, a 75 grain TMJ round, we get 165 ms for the bullet (crack to arrive), with a crack-to-boom that should average 213 ms, consistent with one of those three shots.
A shorter (than standard) barrel is more likely than an uncommon bullet. Ballistics tables tend to use the standard 20 inch barrel length for .223 caliber or 5.56 mm ammunition. The shorter the barrel, the less time powder burns behind the bullet, and the slower the round travels. See a detailed look and a summary. Comparing images of AR-15s with various barrel lengths to the images of the rifle on AGR’s roof, it appears that the rifle on AGR’s roof had a 16 inch barrel rather than an M-4 barrel of 14.5 inches or an old-school 20 inch barrel. From above, there is a 200 ft/s to 300 ft/s drop in muzzle velocity when going from a 20 inch barrel to a 16 inch barrel. Suppose, then, a 250 ft/s drop in average muzzle velocity from the ballistics chart, and the average of the 55 grain bullet would be 2741 ft/s instead of 2991 ft/s. That means about 158ms of bullet travel, with crack-to-boom delays of around 220 ms, which is consistent with the first three shots’ crack-to-boom delays.
Is a shooter on the water tower plausible?
The water tower was 244 meters (801 feet or 267 yards) from the stage microphone.

Suppose a fast .223 round (the same 55g round as above) traveled 267 yards, it would average 2805 ft/s from a 20 inch barrel (using the same technique as above, 10-yard increment average from 0 to 270 yards), taking 286 ms to arrive, with the boom taking 698 ms to arrive, giving a crack-to-boom delay of 412 ms. In order to arrive at a 220 ms crack-to-boom duration from 267 yards (801 feet), a bullet would have to travel for 478 ms over those 801 feet, 801 feet / 0.478 seconds or 1676 ft/s. It is implausible that any .223 caliber or 5.56 mm round would have been used from there because the barrel would have to be so short that it would be too inaccurate at that range. There is at least one round that could average 1676 ft/s over the first 270 yards, namely 300 Blackout.
A water tower shooter cannot be ruled out by crack-to-boom analysis alone because there is at least one rifle round that would yield the recorded (220 or so ms) crack-to-boom delay for the first three shots.
Limitations of crack-boom analysis
The above discussion makes it clear that crack-to-boom analysis provides some answers (for example, disproving Theory 1) but there many variables that make answers from crack-to-boom durations imprecise. The variety of ammunition and rifle lengths were seen above. Furthermore, within a single batch of ammunition there is significant variation in speed. Even with fixed microphones on the field the problem of the actual path of the bullet arises. All of these add up to too much variation to make confident assertions about where shooters were from crack-boom analysis alone. Theory 2 is still possible with the above analysis.
General vicinity of the shots fired
Audio fed to multiple news agencies give a sense of the distance to the shooter of the first three shots. The brief pause between shots allows one to see the crack-then-boom pattern for three shots. While a minimum theoretical range of 81 yards can be found using the crack-to-boom durations from the stage microphones (see above), not much more about original location of the first three shots can be derived.
Footage from Jon Malis, Dave Stewart, and whoever sent footage to TMZ, all three of which are near the AGR complex, indicate that the first eight shots were near AGR. The cracks and booms are either reversed (Jon Malis, TMZ) or have a very short duration (Dave Stewart).
Proving or disproving multiple shooters
Because there are multiple recordings from multiple areas of the Butler County Fairgrounds there is a way demonstrate the count of shooter positions. Using crack-to-boom is difficult for multiple reasons. Shots three through eight are so rapid that pairing cracks with booms is difficult. In some videos, discerning cracks is difficult. In other videos, discerning booms is difficult. The duration between cracks and booms can vary for many reasons, as mentioned above. However, due to diverse locations of microphones, booms emanating from shooting positions and having a consistent travel path at least to fixed microphones, and the ability to locate booms within a few milliseconds on a timeline, it is possible to use boom-to-boom analysis to discover whether two shots were fired from the same location.
Boom-to-boom analysis
Theoretical scenarios
Suppose two shooters, shooter A and shooter B, are fifteen feet away from each other on a field. Suppose there are two microphones, microphone C and microphone D, also fifteen feet from each other are symmetrically positioned one hundred fifty yards away from the shooters. Drawing a line from A to B, B to D, D to C, and C to A makes a long rectangle if each position is a point on a graph.

Further suppose the following sequence of events. Shooter A takes one shot, one second later shooter B takes one shot, and another second later shooter A takes another shot. Ignoring the cracks altogether, from the microphones C and D, the sequence of boom sounds is roughly a boom, a 1000ms delay, a boom, a 1000ms delay, and finally another boom.
More strictly, from microphone C, it is slightly more than 1000ms from shot 1 to shot 2 and slightly less than 1000ms from shot 2 to shot 3, due to C being about a quarter foot further from B than A. Likewise for microphone D, it is slightly less than 1000ms from shot 1 to shot 2 and slightly more than 1000ms from shot 2 to shot 3, also due to D being about a quarter foot further from A than B. The time difference between shots will be less than a millisecond because the speed of sound is about 1147 ft/s, or more conveniently 1.147 ft/ms, a quarter of a foot would add or subtract 0.2868 ms from 1000ms. Locating a boom on a timeline using the audio spectrogram varies by a millisecond or two so the timing difference between shooters A and B is too small to be discernible using audio spectrograms of recordings from C and D alone.
Consider the addition of microphones E and F. Microphone E is twenty five yards toward microphone C from A and then ten yards up a perpendicular line away from the line A to C. Microphone F is twenty five yards away from B extending a line from A to B. Microphone E is therefore just under 81 feet away from A and just over 87 feet away from B. Microphone F is 75 feet from B and 90 feet from A.

The difference between shooting locations A and B now results in a noticeable difference of delay between booms for E and F when compared to the delays for microphones C and D. The delay from shot 1 to shot 2 for microphone E will be 6-7 ms longer as compared to the delay at C. Likewise, the delay from shot 2 to shot 3 will be 6-7 ms shorter as compared to the delay at C. The difference is greatest for microphone F because it hears the full difference of the 15 feet, resulting in just over a 17 ms difference in boom-to-boom delays. Specifically, at microphone F, it would appear as a boom, a 982 ms delay, a boom, a 1017 ms delay, and the last boom.
If shots were only taken from A and none from B, all three booms would come from A, and there would be no difference in boom-to-boom delays at any of the microphone locations. All would have two 1000 ms delays. Even with 2 ms errors on each placement of booms on a timeline, we would see no less than 996 ms and no more than 1004 ms delays between shots.
The gist is that when audio recordings are available from several locations near where multiple shots are fired, multiple shooting locations (shooters) will become more and more obvious the more those recordings surround the shooter. The more recordings from the more locations, the more confident the conclusion of whether or not there were multiple shooters. Even a difference of ten feet will be discernible assuming at least three recording locations spread widely enough around the shooting location(s). If there is one shooting location, all the boom-to-boom delays will be identical. If there are two shooting locations, the boom-to-boom delays will vary in one or more recordings.
Boom-to-boom analysis at the rally
There are audio recordings from multiple locations at the rally.
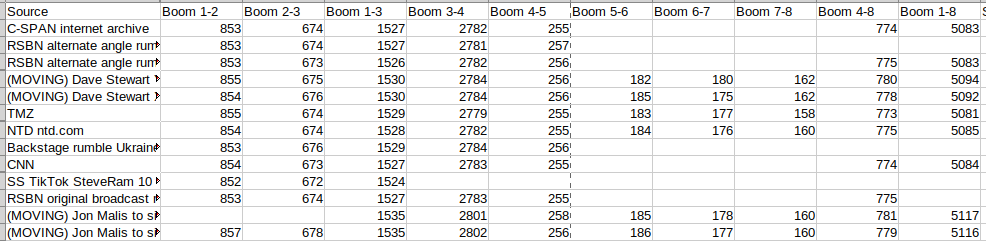
CNN, C-SPAN, RSBN, and NTD (collectively, “news”) have boom one to boom two from 853 ms to 854 ms. The same have boom two to boom three from 673 ms to 674 ms. This is remarkable agreement. Agreement is not surprising given that they all likely shared the same microphone. However, the NTD audio is different enough that it could be a different microphone in a different location.
More remarkable are delays of 855 ms and 674 ms in the TMZ video respectively, far away from the news microphones, and West of the AGR complex rather than South of it. This is only 0-2 ms different from the news.
For videos where the microphone moves, namely those from Jon Malis and Dave Stewart, the individual boom-to-boom delays are very close to the news and TMZ. For example, Dave Stewart’s are 854-855 ms for booms 1-2 and 675-676 ms for booms 2-3. Jon Malis has 857 ms for booms 1-2 and 678 ms for booms 2-3. This is the most different delay among audio with clearly discernable booms and yet it is only a 3-4ms difference for each of those from the news and TMZ. The cumulative difference in overall boom-to-boom delays is clearer. Dave Stewart’s boom one to boom eight delay is 5092-5094 ms versus the news’ 5083-5085. Jon Malis’ boom one to boom eight delay is 5116-5117 ms.
The above selection is from videos where booms are clear enough to discern. The widest disparity is from those that were moving while recording. It is not clear from the video images if the TMZ videographer moved (the audio suggests TMZ did not move much due to agreement with the fixed news microphones). If the differences in booms were to be explained by different locations of shooters in the Dave Stewart and Jon Malis audio, one would expect at least one pair of shots to have a wider difference than the rest. Instead it is a little bit for each, consistent with a person moving with a camera.
The boom-to-boom analysis shows that shots one through eight all came from the same location. The boom-to-boom technique cannot show whether the shots came from the AGR roof, an AGR window, a water tower, or somewhere else, only that they came from the same location on the grounds. The boom-to-boom technique cannot prove there was not another shooter directly above or directly below the first shooter. Theories two and three are still possible with regard to boom-to-boom analysis, but not in combination with theory zero.
Conclusion
Three shooters fired ten shots. The first eight have similar signatures in all available videos. Shots nine and ten differ from each other and from the first eight. Boom-to-boom analysis shows shots one through eight came from a single (horizontal) location, not multiple locations. Given the similarity of signatures on shots one through eight, it is unlikely that these came from shooters above and below one another, because that would imply one shooting from a roof and one shooting from inside a building and such sound signatures would differ. Crack-to-boom analysis from videos nearer AGR indicates that the shots came from near AGR. The delays from crack to boom are much shorter (in the case of Dave Stewart) or even in reverse order (in the case of TMZ and Jon Malis). Both crack-to-boom and boom-to-boom analyses are consistent with theory zero, namely a person with an AR-15 with a 16" barrel fired eight shots from an AGR roof. Given the body, rifle, and eight brass casings left on the AGR roof, the most likely conclusion is a single shooter fired shots one through eight from the AGR roof. Theories two and three are unlikely. Theory zero stands strong.